Source: Unsplash
Wanting to learn more about developing and measuring indicators, I chose to explore several different techniques for a final project in order to earn a M.S. Foresight degree from the University of Houston. While searching for indicator methods, I came across the following thesis paper titled “How Should Indicators be Found for Scenario Monitoring?,” written by Zheng He in 2013.
Zheng He found other scenario monitoring methods to be lacking and so created a hybrid technique through a synthesis of existing indicator methods. I was intrigued by his proposed process that assigns drivers of change a numeric value for the purpose of monitoring changes in the value over time. These changes indicate the strength of drivers contributing to particular predetermined scenarios.
The scenario I used to find and measure indicators is featured in a Bloomberg video titled “Here’s How Electric Cars Will Cause the Next Oil Crisis,” published in 2016. It describes the global demand for oil quickly diminishing based on an interplay of cheap solar energy and an increase in electric vehicles. I called this scenario “Here Comes the Sun.”
This novel scenario indicator method combines the 10-step indicator method developed by OECD (Organization for Economic Cooperation and Development) in 2008 with data/frame theory of sensemaking developed by Klein, Moon, and Hoffman (2006). It monitors scenario development by creating “composite indicators” that measure the strength of driving forces which contribute to particular scenarios. Measuring the numeric value change of each driver helps to better identify which scenario is unfolding. I found this to be a very valuable technique if you have the time resources to invest.
Step 1: Develop a Theoretical Framework
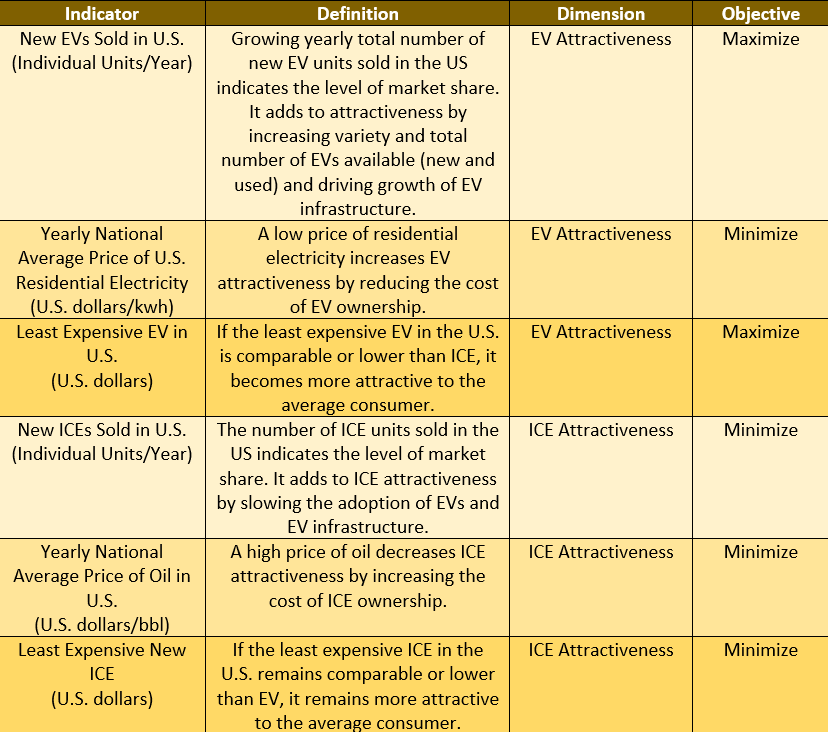
A theoretical framework needs to be developed in order for proper individual indicators to be chosen and for the data analysis to make sense. The composite indicator represents the driving force and will include the variables of dimension, individual indicators, and the objective of the individual indicators.
Step 2: Selecting Variables/Individual Indicators
Use STEEP categories to find potential indicators that describe the driver. Choose potential indicators based on relevance and availability. Then, choose individual indicators from potential indicators based on non-repetition, coverage, and data-availability.
Example – Driver #1: Electric Vehicle Demand
Composite Indicator: EV Demand
Dimension 1: EV Attractiveness. Objective: Maximize
Dimension 2: Internal Combustion Engine (ICE) Attractiveness. Objective: Minimize
Step 3: Imputation of Missing Data
If indicators have years with missing data, use mean/median/mode, trend regression, or simply ignore the missing data, which is not recommended but may become necessary in certain situations.
Step 4: Normalization of Data
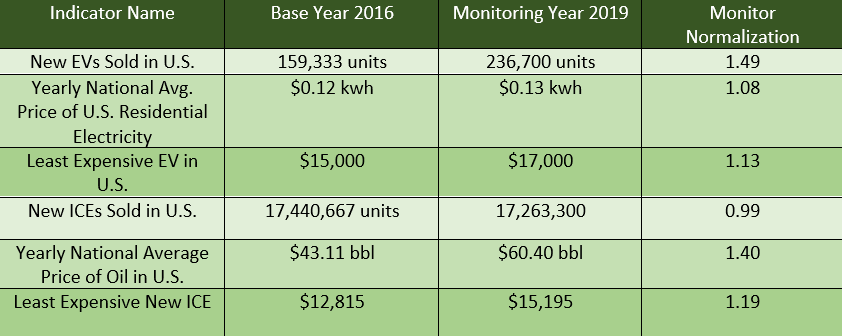
Several methods could be used, but the author recommends normalizing data to the base year by dividing the monitoring year data by the base year.
Step 5: Multivariate Analysis
This step helps to eliminate human bias when choosing indicators. There are several methods of multivariate analysis but the author chose factor analysis because it assigns a weight to each component of the composite indicator according to its contribution to the total data variance. I did not use this step as it was not needed for my own project.
Step 6: Weighting and Aggregation
Weighting Method: The author suggests using rotated component matrix from the factor analysis.
Aggregation Method: Linear or non-linear can be used but linear is much easier and recommended.
Aggregated Composite Indicator Scores (Without Weighting)
Step 7: Scenario Monitoring
The final step is to use the composite indicator scores to measure the strength of the drivers to monitor proposed scenarios. The method is to choose boundary values for your final indicator scores. If the score is above this boundary then the driver strength would be assigned “high,” below the boundary assigns “low,” and anything in between remains “uncertain.”
In this example, all of the drivers contributing to the scenario have grown in strength from 2016 to 2019. This result indicates that the scenario is on track and more likely as of the first monitoring year. Normally, the monitoring dashboard would have multiple scenarios instead of just one.
Final Thoughts: Despite the hard data, there still remains several elements of guesswork which can skew the output, particularly in determining boundary/threshold values and dimensions for the composite indicators. The more I tried to properly label and identify composite drivers and dimensions, the more I came to the realization that there is no perfect way for it to be accomplished. This entire process is very similar to the process of framing a domain. What seems reasonable during a first attempt usually ends up being edited many times over in order to cover all that needs to be covered without ending up with redundancies. The author does address this issue, but perhaps not to the level of importance to which it deserves. I think a majority of work performed with this process would be in revising the framework.
“…the first theoretical framework should be tested by the data. If the data are inconsistent with it, new framework should be proposed until no evidence is contradicted with it.” – Zheng He (2013)
All in all, I found this to be a very good method for developing and measuring composite indicators to measure the strength of driving forces in monitoring years.

Seth Harrell, M.S. Foresight, University of Houston
Association of Professional Futurists – Emerging Fellow 2022
@ForesightSeth
You can find more of Seth’s foresight writings or contact him by visiting www.imagineforesight.com


