Our design expert on the Houston Foresight team, student Maria Romero, is at it again. After doing a beautiful job with updating the Framework Foresight process and cone, she turned her attention to our scanning process. The history of “our scanning process” merits a few comments. For years we have been teaching scanning with a minimal structure or process, noting the “arti-ness” of it (more art than science). It was always a bit unsatisfactory to get to that point, so a few years ago, I started looking for ways to bring more process and structure to our scanning. As always, we did the beta with students, and tinkered and adjusted, and maybe a year or so ago, I feel like we came up with a pretty solid process. 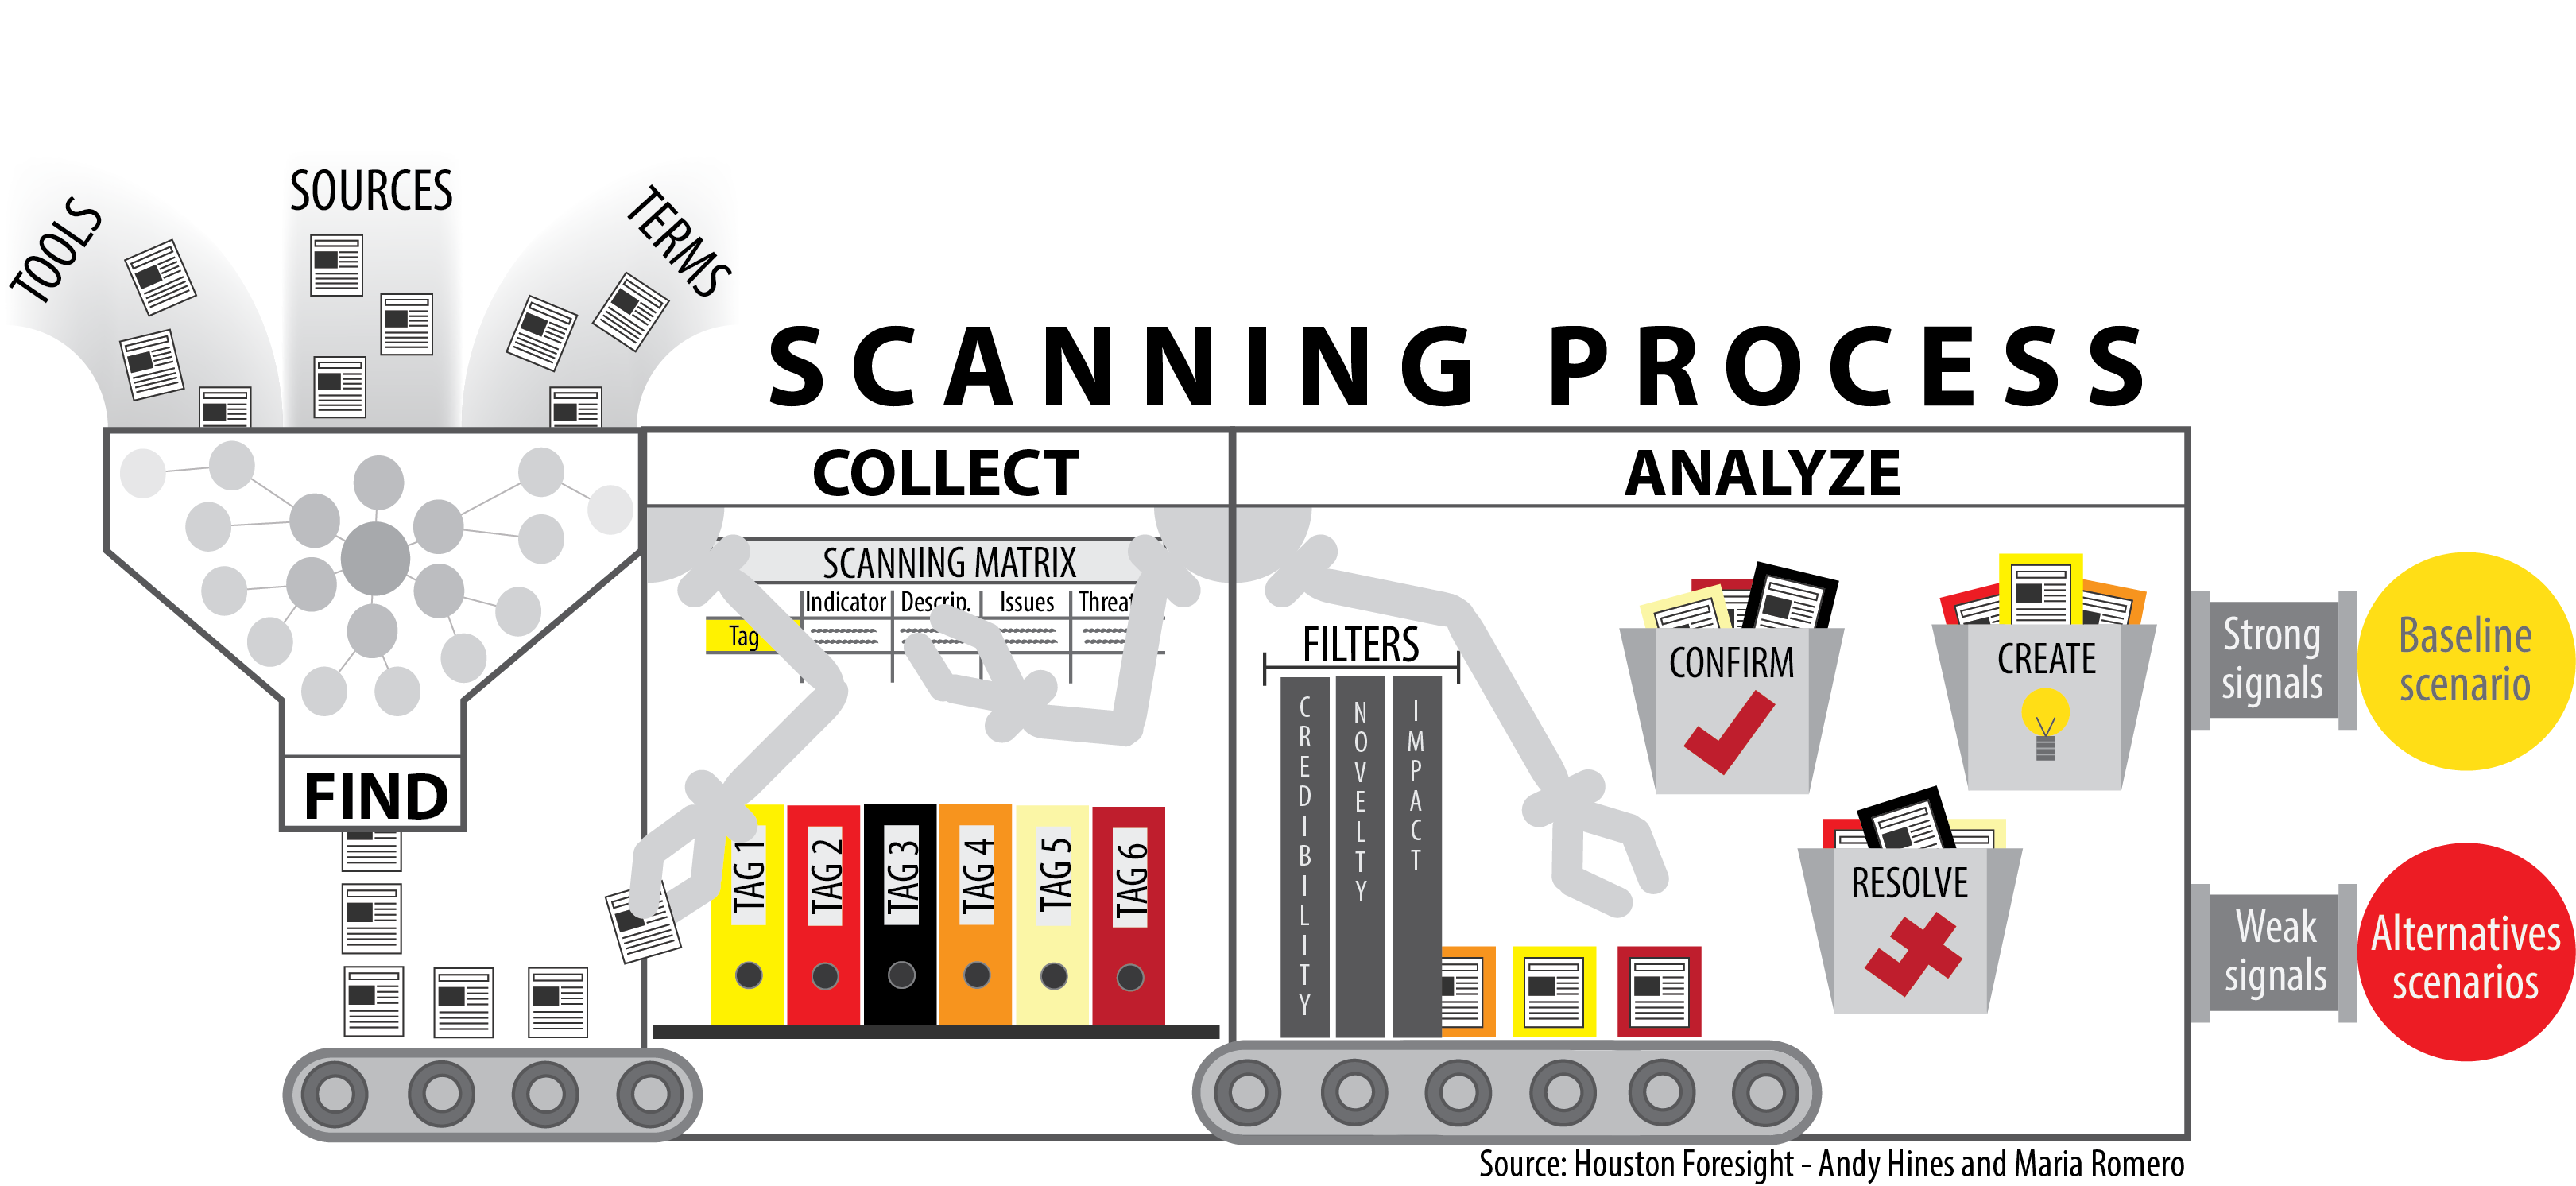
The quick-and-dirty explanation. We organized the scanning process into three steps: finding, collecting, and analyzing.
- Finding involves the tools, sources, and terms for identifying the signals of change, i.e., scanning hits.
- Collecting is about how to capture the hits. The old-fashioned spreadsheet is still an option, but we have been using cloud-based libraries. Our favorite is Diigo. They allow a team of remote folks (which is pretty much how every team works these days) to tag hits to a common library. Super-convenient!
- Analyzing can be done at three levels (1) a simple triage (2) more detailed evaluation using two or three criteria, such as novelty, impact, credibility and (3) a much more involved multi-criteria and weighted index (for the true evaluation fanatics).
The graphic shows a couple of outputs — the “strong” signals of change feed the baseline forecast, and the “weak signals” provide ideas and inspiration for the alternative futures.
A tip of our collective hat to Maria for such a wonderful representation. Andy Hines


